Crypto markets never close. The implicit pressure on participants is that they should also never close — that every overnight move, every weekend pump, every Asian-session liquidation requires real-time attention. This is wrong, and the cost of believing it is twofold. Your sleep deteriorates and your trading gets worse.
The traders who outperform over multi-year horizons share one habit that almost nobody talks about: they pay attention to less, not more. A structured, time-limited information routine outperforms continuous attention by a wide margin, for reasons that are mechanical rather than mystical.
Why continuous attention degrades decisions
Three effects compound. Reaction fatigue: every alert, every notification, every price movement triggers a small cognitive response. The cumulative effect over weeks is exhaustion, which manifests as worse risk management. Recency bias: the most recent price action dominates your perception of the market state, which means a trader watching every five-minute candle will systematically over-weight short-term noise relative to medium-term trends. And action bias: the more you watch, the more you feel pressure to act. Most of the time, the correct action is none.
A sustainable routine that takes thirty minutes per week
Twenty minutes on Monday morning, ten minutes on Friday afternoon, and that’s the entire weekly time budget for most non-professional traders.
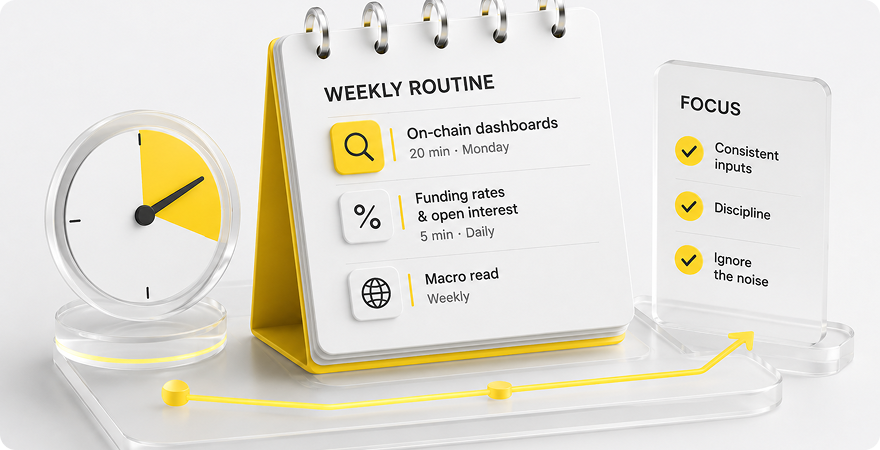
Monday morning, twenty minutes: read one weekly market summary from a source you trust (the Bankless newsletter, The Block’s weekend wrap-up, or similar). Check the BTC and ETH weekly charts on the daily timeframe. Glance at funding rates and open interest. Look at on-chain exchange flow trends for the past week. That’s it. The goal is to enter the week with a directional bias, not a thesis on every asset.
Friday afternoon, ten minutes: review the week’s performance against your bias. Note one thing that surprised you. Note one thing you got right. Adjust the bias for next week. Don’t trade in this window — review only.
What to remove
Push notifications from price-alert apps, except for specific levels you’ve pre-decided matter. Telegram and Discord channels that produce more than ten messages per day. Twitter accounts that post more than twenty times per day on crypto. YouTube channels whose primary business model is keeping you watching. Any source that uses the word “MASSIVE” or “INSANE” in headlines. The selection criteria is signal density per minute, not entertainment value.
What to keep
One or two newsletters with high signal density. One or two long-form analysts who post weekly rather than hourly. Direct access to on-chain data dashboards (Glassnode, CryptoQuant, DefiLlama) that you check on your schedule, not theirs. The exchange’s official communications for the platforms you use. Macro information sources — Bloomberg, Reuters, FT — for the broader context that increasingly drives crypto.
The longer-term framing
Markets reward patience and punish urgency. A trader who participates with thirty minutes of weekly attention and a sustainable routine will, over five years, almost certainly outperform a trader who participates with thirty hours of weekly attention and a deteriorating one. The former has a sustainable practice. The latter has a hobby that’s slowly consuming them.
The market will be here next week. So should you be.
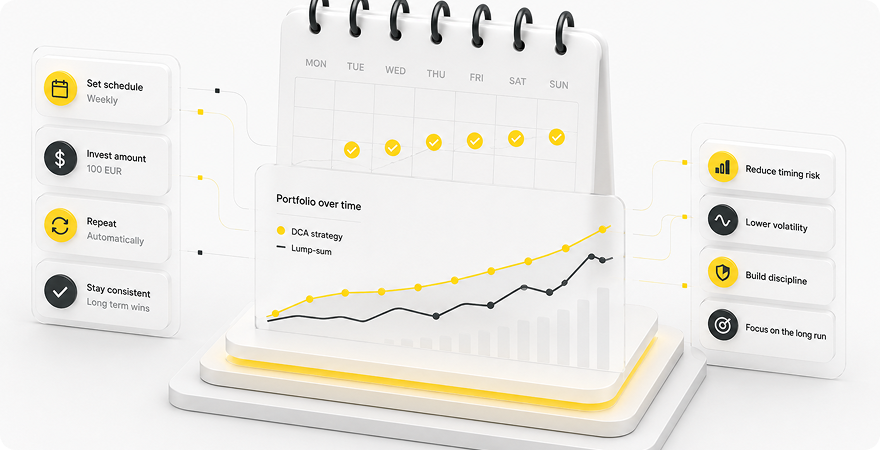
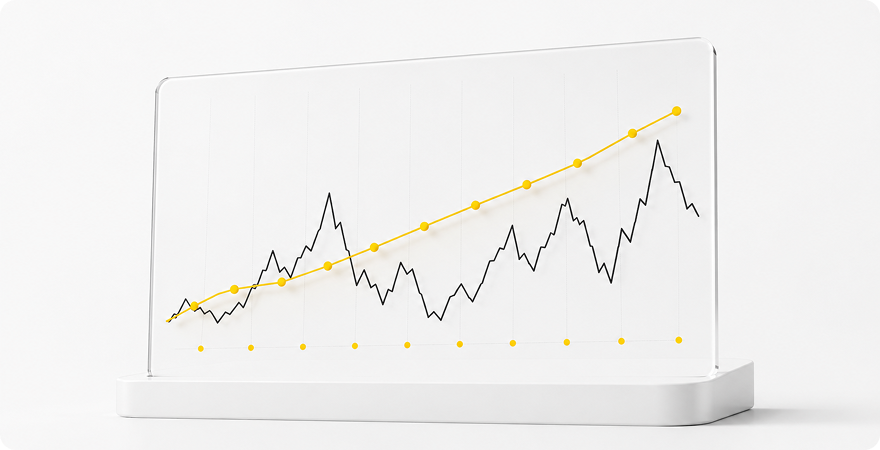
Dollar-cost averaging is the strategy nobody finds exciting and almost everyone should be using. The reason is not that DCA produces the highest possible return — it doesn’t — but that it produces near-optimal returns for the actual human behaviour of the people executing it. The strategy that you can stick to through a fifty percent drawdown is worth more than the strategy that mathematically dominates in a spreadsheet but breaks down in your head at the moment of stress.
What DCA actually does
Dollar-cost averaging buys a fixed dollar amount of an asset on a fixed schedule, regardless of price. The mechanical effect is that you buy more units when the price is low and fewer units when the price is high, which produces an average entry price below the simple time average of the asset’s price over the period. The psychological effect, which matters more, is that the schedule replaces decision-making. You don’t have to time the entry, which means you can’t time it badly.
The case for DCA in crypto specifically
Crypto’s volatility makes timing both more tempting and more punishing. The asset class regularly produces 50% drawdowns and 200% rallies in compressed timeframes. The trader who tries to time entries is making high-stakes decisions in an environment specifically designed to defeat human pattern-matching. Studies of retail trading data — across both crypto and traditional markets — consistently show that retail traders underperform a simple buy-and-hold benchmark by a meaningful margin, and the underperformance is almost entirely attributable to bad timing rather than bad asset selection.
DCA removes timing as a source of error. Over a multi-year horizon in crypto, a weekly or monthly DCA into Bitcoin has historically outperformed approximately 90% of attempts at active timing by the same investor over the same period.
Where DCA underperforms
In persistently rising markets, lump-sum investment outperforms DCA by definition. If you have $12,000 to deploy and the asset rises monotonically over the next twelve months, deploying all of it on day one produces a higher return than spreading it across twelve monthly purchases. This is the case academics use to argue against DCA, and it’s mathematically correct. The problem is that you don’t know in advance whether the next twelve months will be a persistent uptrend or a 60% drawdown followed by a recovery. DCA loses a small amount of return in the first scenario and saves a large amount in the second, which is a favourable expected-value trade for most investors.
A reasonable DCA approach for crypto
Pick a fixed amount that’s small enough to be sustainable for at least twelve months and that doesn’t disrupt your other financial obligations.
Choose a frequency — weekly or monthly are both fine. Automate the recurring purchase via the exchange’s scheduled buy feature. Don’t change the schedule based on price action. The point is to remove the decision, not to add a new one.
When to break the pattern
Two cases. Tax-loss harvesting at year-end, where a tactical adjustment can reduce tax liability without changing the underlying thesis. And generational drawdowns — Bitcoin at $15,000 in late 2022, for example — where the asset is trading at a structurally low price relative to its long-term trajectory. Outside those cases, the discipline is the strategy.
The most successful crypto investors over five-year horizons are not the ones with the cleverest entries. They’re the ones who kept buying through the cycles when everyone else stopped.
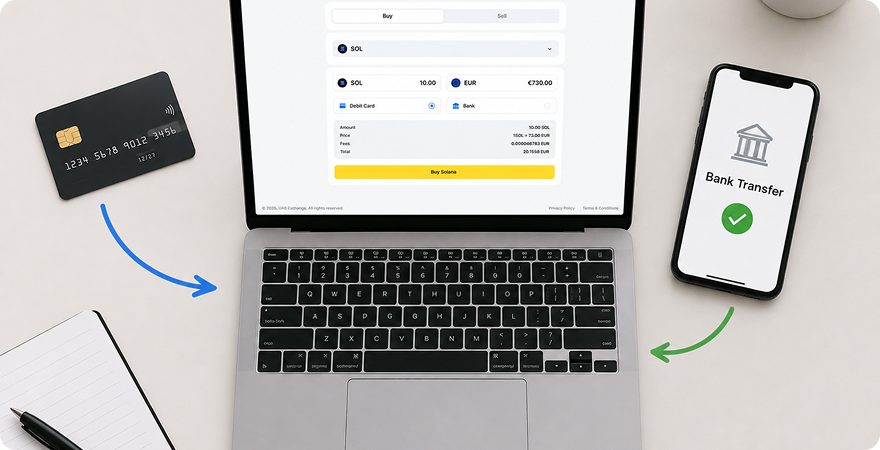
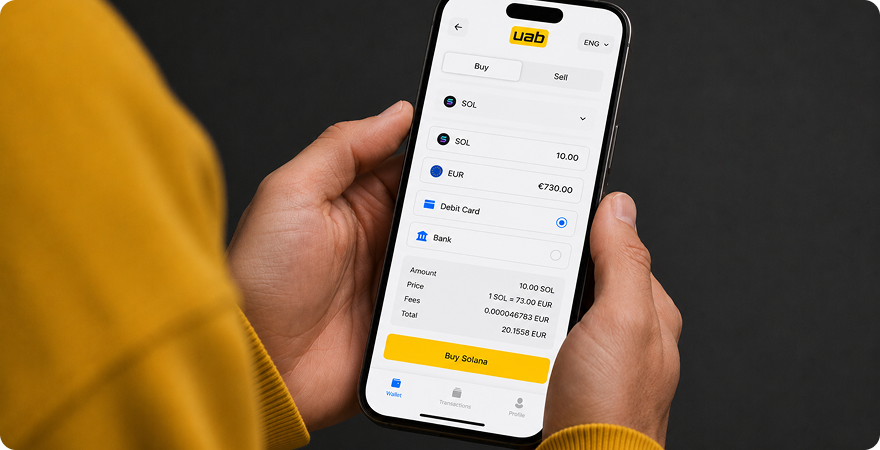
The choice between funding a crypto purchase with a debit or credit card versus a bank transfer is one of the small decisions that quietly determines a beginner’s cost basis. The right answer depends on three variables: how much you’re buying, how time-sensitive the purchase is, and how much you trust your own ability to time the market. You can use e-Pocket to send money to Panama today. To learn more about the countries on our extensive platform, read our blog page.
Card purchases
Speed is the entire advantage. A card purchase typically completes in under a minute. Funds clear, the trade executes, and you hold the asset before your coffee gets cold. The cost is meaningful: most exchanges charge between 2.5 and 4 percent in card processing fees, and the spread on a card-funded buy is often wider than the spread on a wire-funded buy at the same exchange. The all-in cost of buying $1,000 of Bitcoin with a card on most major exchanges lands between $40 and $60. The same purchase via bank transfer typically costs $5 to $15.
There’s also a counterparty risk worth flagging. Some banks treat crypto exchange card transactions as cash advances rather than purchases, which can trigger higher interest rates and immediate finance charges on credit cards. Check the cardholder agreement before assuming a card purchase will be treated like any other transaction.
Bank transfers
Cheaper, slower, and operationally more involved. SEPA transfers within the Eurozone typically settle same-day or next-day at near-zero cost. ACH transfers in the US take one to three business days. SWIFT wires internationally take one to five business days and carry fees on both ends. Faster options exist — SEPA Instant, Faster Payments in the UK, OSKO in Australia — but availability depends on both the sending bank and the exchange’s banking partnerships.
The slowness has a hidden cost: price exposure during the transit window. If you initiate a bank transfer to buy Bitcoin at $60,000 and the price moves to $63,000 before the funds arrive, you’ve effectively paid a five percent cost on the trade — much higher than the card fee would have been. For volatile assets in volatile markets, the speed advantage of card can outweigh the fee disadvantage.
A reasonable decision rule
For purchases under $500, the absolute dollar difference between card and bank transfer is small enough that convenience usually wins. Use card. For purchases between $500 and $5,000, the fee difference becomes meaningful but the price exposure risk during a bank transfer is moderate. Bank transfer is usually correct unless the market is moving sharply. Above $5,000, bank transfer is almost always correct on cost, and the price exposure can be managed by purchasing in tranches as funds clear.
Two practical patterns that work well
First, keep a stablecoin balance on the exchange to act as a “dry powder” buffer. This lets you buy instantly without card fees by converting stablecoins to the target asset, then top up the stablecoin balance via bank transfer at your leisure. Second, if you’re dollar-cost averaging on a fixed schedule, bank transfer with recurring deposits is the right pattern. The price exposure during transit averages out across many purchases, and the fee savings compound.
Card is for urgency. Bank transfer is for cost discipline. Stablecoin balance is for both.
The single highest-return hour in crypto trading is not spent watching charts. It’s spent researching the asset before the position is opened. A trader who spends sixty minutes doing structured due diligence on a token before buying typically outperforms one who buys on a thesis built from social media — not because the research produces better entry timing, but because it filters out the trades that should never have been opened in the first place. A seven-question framework covers most of what matters.
You can use e-Pocket to send money to Panama today. To learn more about the countries on our extensive platform, read our blog page.
One: what does this protocol actually do, in one sentence?
If you cannot describe the protocol’s function in a single non-technical sentence, you don’t understand it well enough to take a position. Vague answers (“it’s a decentralised infrastructure layer for the next generation of web3”) are a red flag. Specific answers (“it’s a derivatives exchange that runs on its own appchain”) are workable.
Two: who is using it, and is that usage growing?
On-chain data tells you this. Active addresses, transaction count, total value locked (for DeFi protocols), revenue generated (for protocols that generate revenue). Look at the trend over the last six months. A protocol with stable or growing usage is fundamentally different from one with declining usage, regardless of how compelling the marketing is.
Three: where does the revenue come from, and who captures it?
Many crypto protocols have no revenue. That’s fine for early-stage infrastructure but troubling for protocols that have been operating for years. For protocols that do generate revenue, the question is whether token holders capture any of it. The answer is often no — and that fact alone reframes the investment thesis significantly.
Four: what’s the token supply schedule?
Most crypto tokens have ongoing emissions. A token with high inflation needs proportionally high demand growth just to stay flat in price. Check the unlock schedule for team and investor allocations. Large unlocks in the next twelve months are persistent overhead supply that affects price independent of any other factor.
Five: who are the major holders, and how concentrated is the supply?
Highly concentrated supply means a small number of wallets can move the market. Check the top one hundred holders on the relevant block explorer. If a handful of wallets control fifty percent or more of the circulating supply, you are effectively trading against their decisions.
Six: what does the team’s track record look like?
Has the founding team shipped previous products successfully? Are they doxxed? Do they have a credible history in the relevant domain? Anonymous teams are not automatically disqualified, but anonymity raises the threshold of proof required elsewhere.
Seven: what’s the bear case?
This is the question most traders skip. If you cannot articulate the strongest argument against the position you’re about to take, you are not ready to take it. The bear case forces you to identify what would have to be true for the thesis to fail, which is also the list of things to monitor after you enter.
Where to find the answers
The project’s documentation (not the marketing site). Token Terminal for revenue and fundamentals. Dune Analytics for on-chain metrics. The block explorer for holder concentration. Messari and DefiLlama for protocol-specific data. Twitter for narrative read, but with scepticism — the most enthusiastic accounts are often the most long.
Sixty minutes of structured research will not make every trade profitable. It will eliminate the trades that should never have been opened. That filter alone is worth more than any indicator.
The crypto information environment is loud. Telegram channels, X accounts, YouTube influencers, and trading newsletters produce enough content per hour to occupy a full-time attention budget, and most of it is noise. Cutting through to the signal that actually matters is less about consuming more and more about consuming better. Five categories of data tend to lead price action. Everything else lags.
You can use e-Pocket to send money to Panama today. To learn more about the countries on our extensive platform, read our blog page.
On-chain flows
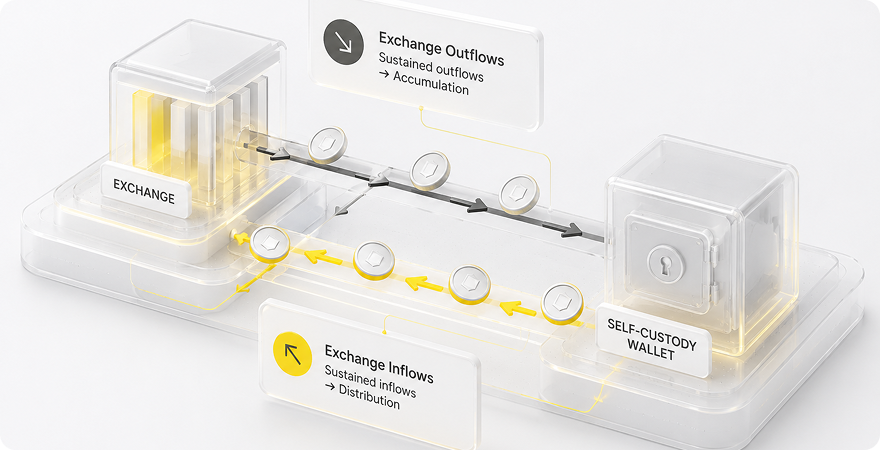
The movement of coins between exchanges and self-custody wallets is one of the few genuinely leading indicators in crypto. Sustained exchange outflows historically precede accumulation phases; sustained exchange inflows tend to precede distribution. The data is public and free — Glassnode, CryptoQuant, and Nansen publish dashboards — and most traders ignore it because it doesn’t produce a clean buy or sell signal. It produces a directional bias.
Stablecoin supply changes
Large mints of USDT or USDC are capital entering the crypto ecosystem; large burns are capital exiting. Net stablecoin supply growth over a one to two week window correlates strongly with subsequent market direction. This is not a precise timing tool, but it tells you which side of the trade has the wind behind it.
Funding rates and open interest
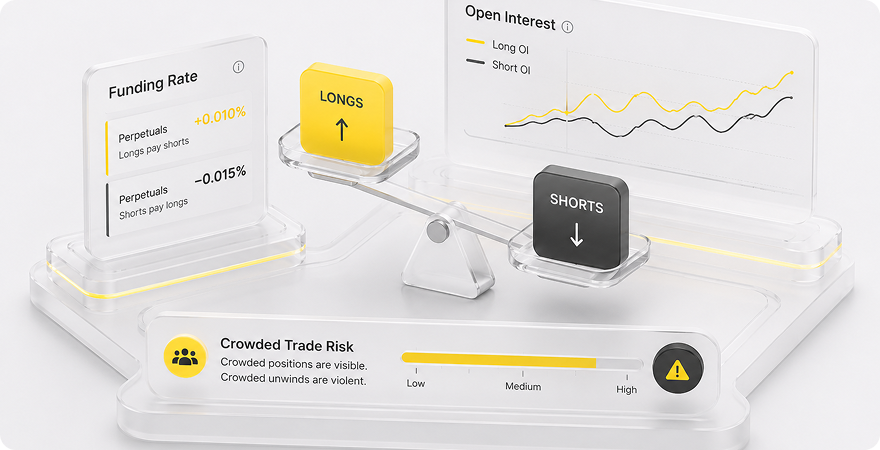
The derivatives market is several times larger than spot, which means derivatives positioning often determines short-term price action. Funding rates show whether longs or shorts are paying the premium; persistently positive funding signals an overcrowded long, persistently negative signals an overcrowded short. Combined with open interest trends, this gives a read on where the crowded trade is — and crowded trades unwind violently.
Macroeconomic context
Bitcoin in particular trades increasingly as a macro asset. US dollar strength (DXY), real yields, and central bank policy direction all matter. A trader who ignores macro because “crypto is independent” is operating on a thesis that has been wrong for most of the last four years. The relationship is not always linear, but it’s persistent.
Narrative momentum
This is the soft signal that’s hardest to measure and most often dismissed by analytical traders, which is exactly why it works. Sector rotation in crypto — AI tokens, real-world assets, Layer 2s, DePIN, memecoins — is driven by narrative more than by fundamentals. The trader who reads narrative early and exits when it goes mainstream consistently outperforms the trader who waits for confirmation.
What to ignore
Most chart pattern analysis below the four-hour timeframe is essentially noise. Most “whale alert” social posts are either too late to act on or are themselves a coordination signal rather than a genuine flow indicator. Most price predictions from anyone who isn’t disclosing their position are entertainment, not analysis.
A reasonable weekly routine
Twenty minutes on Monday morning checking on-chain dashboards. Five minutes daily checking funding rates and open interest. A weekly read on macro positioning. And a rolling list of three to five active narratives to track. That’s the entire input set for most traders below institutional size. Anything beyond it produces marginal information at increasing time cost.
The traders who consistently outperform are not the ones consuming the most market commentary. They’re the ones who’ve narrowed their inputs to the few categories that actually lead, and disciplined themselves to ignore everything else.
Positioning line: “From first trade to larger market moves, UAB Exchange supports a smarter way to explore crypto opportunities.” Target keyword: crypto OTC vs exchange Secondary keywords: large crypto trade slippage, when to use OTC crypto Search intent: Informational / commercial Funnel stage: MOFU — for traders graduating from retail size Meta description (152 ch): At some trade size, the exchange order book stops being your friend. The threshold where retail crypto trading turns into OTC, and how to recognise it. CTA: Request an OTC quote from UAB Exchange.
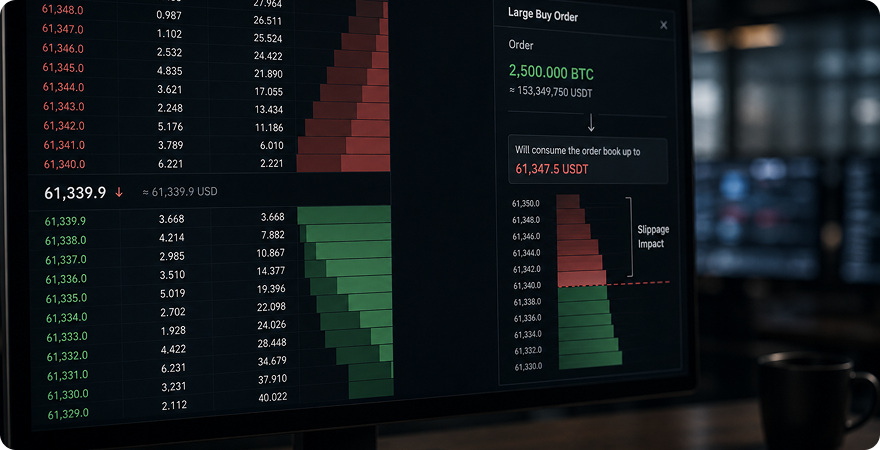
Most crypto traders never need to think about order book depth. At trade sizes below $10,000, almost any major exchange will fill at the price you see on screen. The market is liquid enough at retail size that the only fees that matter are the visible ones. This breaks at a specific threshold, and the threshold is not as high as most traders assume.
Where slippage starts to matter.
Slippage — the difference between the expected price and the executed price — scales with two variables: the size of your order relative to available liquidity and the asset’s volatility. For BTC/USDT on a major exchange, slippage typically remains under 10 basis points for orders up to about $100,000. For mid-cap altcoins, the same slippage threshold can be reached at $10,000 to $25,000. For thinly traded pairs, it can be reached at $5,000.
If you’ve ever placed a market order and noticed the fill price was meaningfully worse than the quoted price, you’ve crossed your threshold. The fix is not to keep using market orders. It’s to change the execution method.
Three execution methods, in order of size.
Market orders work fine at retail size. Limit orders, which only fill at a specified price or better, extend the workable range up to roughly the point where the order would consume more than two to three percent of the visible order book on a major venue. Algorithmic execution — TWAP, VWAP, or iceberg orders — extends the range further by breaking a large order into many smaller pieces over time, reducing market impact. And above a size that depends on the asset and the venue, the most efficient execution is not on the order book at all. It’s OTC.
What OTC actually is.
Over-the-counter trading is a direct, negotiated transaction between two counterparties, settled off the public order book. For crypto, this typically means a trade is quoted by an OTC desk based on the spot reference price plus a small spread, and settled bilaterally. The advantages: no slippage, no market impact, no public footprint of the trade, and bespoke settlement terms. The cost: a small spread above the screen price, which is almost always lower than the slippage and price impact would have been on the order book.
The threshold that makes OTC worthwhile.
A useful rule of thumb: if the trade size is large enough that executing it on the order book would visibly move the price, OTC is probably cheaper. For BTC and ETH, that typically begins around $250,000. For stablecoins, the threshold is much higher because liquidity is much deeper. For mid-cap altcoins, it can be as low as $50,000.
Beyond size: when else OTC makes sense.
Confidentiality, when the trade is large enough that public execution would signal intent to the market. Settlement flexibility, when the counterparty needs a non-standard settlement currency, network, or timing. And custody arrangements, when the trade involves a transfer of size that requires coordinated movement between custodial arrangements rather than a public withdrawal.
The graduation from retail to OTC is not about prestige. It’s about execution quality. The trader who keeps using market orders at OTC size is leaving meaningful money on the table on every trade.
Positioning line: “Digital assets are reshaping finance. UAB Exchange helps you stay informed, prepared, and connected to the market.” Target keyword: crypto cross-border payments. Secondary keywords: digital assets remittance, stablecoin payments. Search intent: Informational. Funnel stage: TOFU — thought leadership. Meta description (155 ch): Stablecoin settlement now moves more value across borders than some major remittance corridors. Why digital assets are quietly rewriting global finance. CTA: Read UAB Exchange’s quarterly market intelligence.
Most of the public conversation about digital assets is about prices. The more consequential story — the one that will define the next decade of global finance — is about settlement.
Traditional cross-border payments run on infrastructure that is sixty years old. A wire from a bank in London to a bank in Karachi typically touches four to six intermediaries, takes one to three business days, costs the sender between three and seven percent depending on amount, and arrives with foreign exchange margins that are rarely disclosed transparently. This is not because the technology is incapable. It’s because the rails are built around a settlement model designed for an era of telex machines and physical correspondent banking.
Stablecoins changed the underlying economics. A USDT or USDC transfer settles in minutes, costs cents in network fees regardless of size, and clears without intermediaries. The implication is not theoretical: stablecoin annual settlement volume now exceeds the total throughput of several major card networks, and in 2024 it began routinely exceeding Visa’s settlement volume on certain measurement windows. A meaningful share of that flow is genuine cross-border payments rather than crypto-native trading.
Where the impact is showing up first.
Three corridors are leading. Emerging-market remittance: workers in the Gulf and in Europe sending money to South Asia and Africa are increasingly settling in stablecoins on one end and converting at the destination, bypassing the traditional remittance rails entirely. B2B trade settlement: small and mid-size importers and exporters use stablecoin payment to avoid the friction of correspondent banking and to settle outside the working hours of traditional rails. Treasury operations: corporate treasurers in countries with capital controls or currency volatility use stablecoins as a digital dollar substitute when local options are constrained.
What this does not mean.
It does not mean banks are being replaced. The settlement layer is changing, but the customer relationship, regulatory compliance, fraud monitoring, and last-mile fiat conversion still sit with regulated financial institutions. The pattern emerging is closer to “stablecoins as plumbing” — invisible to most end users, but doing the actual work behind familiar interfaces.
The regulatory direction is clarifying, not tightening.
The EU’s MiCA framework, the UK’s stablecoin regime, Singapore’s payment services framework, and the US stablecoin legislation moving through Congress are different in detail but converging on a consistent shape: licensed issuers, full reserve backing, mandatory disclosures, and clear consumer protections. This is the opposite of the uncertainty that defined the previous cycle. For businesses considering integration, the regulatory path is now more visible than it has been at any point in the asset class’s history.
What this means for someone watching the space.
Two things. First, the most interesting use cases for digital assets are no longer speculative; they’re operational. Payment, settlement, treasury, and FX management are where the substantive integration is happening. Second, the line between “crypto company” and “financial company” is getting blurry — and the institutions that adapt early to the convergence will define the next phase of the industry.
UAB Exchange operates at this intersection. The digital-asset market is no longer a parallel financial system. It’s becoming part of the main one.
The structural drivers behind sudden price moves, and what they mean for the decisions traders make before they act.
Series:UAB Exchange — Practical Trading Insights Target keyword:crypto market volatility Search intent:Informational Funnel stage:Top-of-funnel — broad awareness Meta description:Crypto prices can shift several percent within an hour. Understanding what drives that volatility, and how to read it, structures every trading decision that follows. Estimated read time:9 minutes
Crypto markets move at a speed that surprises participants arriving from traditional finance. A stock that declines three per cent in a single session is a meaningful event in equities. In crypto, an equivalent move is routine intraday behaviour. Understanding why digital-asset prices move so rapidly, and identifying which structural factors drive the largest moves, establishes the foundation for every subsequent trading decision. The objective of this analysis is to clarify the mechanisms that produce crypto volatility, identify which categories of information actually lead price action, and translate the structural understanding into operational discipline at the position level.
Why crypto exhibits greater volatility than traditional markets
Three structural factors account for most of the volatility gap between crypto and traditional asset classes. Each factor operates continuously, reinforces the others, and creates the persistent intraday price behaviour that defines the asset class.
Crypto markets trade twenty-four hours a day across a fragmented global venue landscape. No closing bell interrupts price discovery, no circuit breakers apply on most venues, and no centralized clearing mechanism absorbs intraday imbalances. When sentiment shifts on a Saturday evening in Tokyo, the price reflects that shift immediately, and the absence of a coordinated pause allows the move to develop without the structural interruptions that traditional exchanges impose.
The asset class remains comparatively small relative to traditional finance. Total crypto market capitalisation operates in the low single-digit trillions of US dollars, against hundreds of trillions across global equities and fixed income. Smaller markets exhibit greater sensitivity to large orders, which is the structural reason a single concentrated holder rotating a few hundred million dollars can visibly shift the Bitcoin order book in real time. The depth available at any given price level is a function of capital allocated to market-making at that level, and the capital base supporting crypto market-making remains thin relative to the asset’s notional volatility.
Derivatives volume in crypto significantly exceeds spot volume on most measurement windows. The implication is that leveraged positioning, rather than spot accumulation or distribution, drives a substantial share of intraday price movement. When a major price level breaks, forced liquidation of leveraged positions cascades through the order book and amplifies the move beyond what fundamental flows alone would produce. The characteristic sharp wicks visible on crypto charts are not artifacts of the chart rendering; they are the mechanical signature of liquidation cascades resolving in compressed timeframes.
The primary drivers of short-term price moves
Macroeconomic context
Bitcoin in particular has traded increasingly as a macro asset over the past four years. Inflation prints, central bank rate decisions, US dollar strength as measured by the DXY index, and real yield movements all feed into crypto pricing through identifiable channels. A trader who dismisses macro context on the principle that crypto is independent of traditional finance is operating on a thesis that has been empirically wrong for most of the recent cycle. The correlation is not always linear and the lead-lag relationship varies by regime, but the macro channel is persistent and quantifiable across multiple cycles of data.
Liquidation cascades and derivatives positioning
Perpetual futures contracts allow traders to maintain leveraged positions indefinitely, subject to ongoing funding payments and a liquidation threshold defined by the deposited margin. When a position’s mark-to-market loss approaches the deposited margin, the exchange’s automated risk system closes the position to prevent loss exceeding the collateral. The result is forced exit at often unfavourable prices, frequently during periods of rapid market movement. When many leveraged positions reach their liquidation thresholds simultaneously, the resulting forced flow amplifies the underlying price move and produces the cascade dynamics visible during major intraday events.
Funding rates, which represent the periodic payments between long and short holders of perpetual contracts, provide a real-time read on collective directional positioning. Persistently positive funding indicates an overcrowded long position; persistently negative funding indicates an overcrowded short. Crowded positions unwind violently when the prevailing direction reverses, which is why monitoring funding rate trends provides actionable context about where the next cascade is most likely to originate.
Stablecoin flows
Large mints or burns of USDT and USDC frequently lead market movement rather than lag it. Net stablecoin issuance represents capital entering the crypto ecosystem that has not yet been deployed into volatile assets; net stablecoin redemption represents capital exiting. The ratio of stablecoin supply to total crypto market capitalization provides a useful measure of available deployment capacity relative to existing exposure, and trends in that ratio have aligned consistently with directional bias across multiple cycle phases.
Regulatory developments
Regulatory news, whether favourable or restrictive, can shift the market several per cent within minutes of announcement. The market sensitivity to regulatory developments reflects both the genuine economic impact of regulation and the historical uncertainty around the regulatory framework applicable to digital assets. As frameworks such as MiCA in Europe and parallel regimes in other jurisdictions have matured, the volatility response to individual announcements has moderated, but the channel remains active and continues to produce meaningful price events.
Exchange flow data
On-chain analytics platforms track the movement of coins between exchange-controlled wallets and self-custody wallets. Sustained net outflows from exchanges historically correspond to accumulation by participants intending to hold rather than trade; sustained net inflows historically precede selling pressure. The signal is not perfectly directional, but the persistent pattern across multiple cycles has established exchange flow data as a standard input in institutional crypto analysis.
Comparative volatility characteristics
Quantifying the structural difference between crypto and traditional asset volatility clarifies why position sizing and risk management require different defaults in the two environments. The comparison below summarises the principal dimensions that define each market’s behaviour.
Trading hours
24/7, no scheduled close
~6.5 hours per session, weekdays only
Annualized BTC volatility
Typically 50–80%
S&P 500 typically 15–20%
Routine daily move
±3% to ±5%
±0.5% to ±1%
Typical drawdown frequency
20%+ drawdowns multiple times per year
20%+ drawdowns roughly once per decade
Derivatives-to-spot ratio
Several times spot volume
Substantially below spot volume
Circuit breakers
Generally absent on most venues
Multiple tiers of trading halts apply
Liquidation mechanism
Automated, immediate, cascading
Margin calls with discretionary unwinding
The comparison clarifies that crypto’s volatility is not a flaw to be eliminated but a structural property to be accounted for. The same characteristics that produce uncomfortable price action also produce the opportunity profile that defines the asset class. Traders who attempt to suppress this volatility through aggressive timing typically underperform traders who structure their exposure to accommodate it.
Operational implications for traders
The practical translation of structural understanding into trading discipline operates through two principal mechanisms: position sizing calibrated to the volatility regime, and pre-defined exits established before each entry.
Position sizing matters more than entry timing in volatile asset classes. A position that appears appropriately sized at current prices may become uncomfortably large after a thirty per cent adverse move, which is a routine occurrence on crypto’s typical multi-month horizon. The defensible sizing question is not what the expected return suggests but what level of unrealised loss the position can sustain without forcing emotional decisions. Sizing positions under the assumption that twenty to thirty per cent adverse moves are normal produces portfolios that survive the moves crypto routinely produces.
Pre-defined exits eliminate the most expensive category of trading error. Decisions made in the middle of volatility tend to be worse than decisions made before the position is opened. The trader who specifies both a profit target and a stop-loss before entry has converted the most stressful moments of position management into the execution of a previously made decision. The trader who improvises during volatility typically extracts worse outcomes from the same underlying position.
Volatility is not a flaw of crypto markets. It is a structural feature. The trader who structures exposure around it consistently outperforms the trader who attempts to predict around it
Strategic significance
Volatility is the operational environment within which crypto’s return profile is generated. The same structural conditions that produce sharp drawdowns also produce the multi-month narrative cycles — artificial intelligence tokens, real-world asset tokenisation, Layer 2 scaling infrastructure, stablecoin adoption — that drive substantial returns across compressed timeframes. The participants who outperform on multi-year horizons share a consistent characteristic: they accept the volatility as a constant and structure their participation around it, rather than treating it as a problem to be timed away.
The implication for the discipline of trading is that the most consequential decisions occur before the position is opened. Position size, exit criteria, and risk allocation determine the outcome distribution more reliably than entry timing. The traders whose results compound across cycles are not those who predict each move correctly but those who survive the moves they predicted incorrectly with their capital and operational discipline intact.
CONTINUE WITH UAB EXCHANGE Subscribe to our weekly market brief for structural analysis of crypto market dynamics, on-chain flows, and the macro context shaping digital-asset prices.
Cookies preferences
✕
Others
Other uncategorized cookies are those that are being analyzed and have not been classified into a category as yet.
Necessary
Necessary
Necessary cookies are absolutely essential for the website to function properly. These cookies ensure basic functionalities and security features of the website, anonymously.
Advertisement
Advertisement cookies are used to provide visitors with relevant ads and marketing campaigns. These cookies track visitors across websites and collect information to provide customized ads.
Analytics
Analytical cookies are used to understand how visitors interact with the website. These cookies help provide information on metrics the number of visitors, bounce rate, traffic source, etc.
Functional
Functional cookies help to perform certain functionalities like sharing the content of the website on social media platforms, collect feedbacks, and other third-party features.
Performance
Performance cookies are used to understand and analyze the key performance indexes of the website which helps in delivering a better user experience for the visitors.
We value your privacy
We use cookies to improve your experience. Some are essential, others help us with analytics and marketing. You can accept all, reject non-essential, or manage your preferences. See our Cookie Policy